How I Cut Search Latency from 17.77s to 988ms in Production
Context
Search Array is a trading-card discovery web application that allows users to search for specific card sequences and combinations across a large dataset.
It is an existing production system built with Laravel, ReactJS, and PostgreSQL. Because the search logic is complex and the dataset continues to grow, the platform relies on high-performance backend queries and effective caching to maintain a smooth user experience.
I joined the project while it was already running in production. One of my first priorities was improving the performance of its core card search feature.
Since the search endpoint supports combination-based queries, latency has a direct impact on usability—making performance optimization a key focus of this work.
The Problem: Search Was Taking Too Long
In one common scenario (3-card search or more in Campaign Mode), response time was very slow:
- Staging: 12.24 seconds
- Production: 17.77 seconds
At that speed, the feature felt difficult to use, so the team wanted to bring it closer to a more acceptable range.
As someone still early in my career, this became a really valuable opportunity to learn how performance issues appear in real production systems.
My Approach: Start With Measurement
Instead of guessing, I started by adding simple execution-time logging across the main phases of the search process.
// Performance monitoring with multi-phase timing
$firstFlagTime = microtime(true);
// ... processing code ...
$secondFlagTime = microtime(true);
// ... more processing ...
$endTime = microtime(true);
\Log::channel('oncode')->info('mostCard execution time breakdown', [
'total_execution_time_ms' => round(($endTime - $firstFlagTime) * 1000, 2),

'data_processing_phase_1_ms' => round(($secondFlagTime - $firstFlagTime) * 1000, 2),

'data_processing_phase_2_ms' => round(($thirdFlagTime - $secondFlagTime) * 1000, 2),

'data_processing_phase_3_ms' => round(($fourthFlagTime - $thirdFlagTime) * 1000, 2),

'category' => $category,

'result_count' => count($result)
This helped narrow the bottlenecks down to a few main areas.
What I Found
1. N+1 Queries in Relationship Loading
This turned out to be the single biggest win. Some parts of the endpoint were loading related models lazily while iterating through results—causing 100+ separate database queries where only 3–5 were needed.
Before (N+1 Problem):
// Each iteration triggered separate queries for master and cardCategory
$lists = CardList::has('master')->where('list_no', $listNo)
								->where('category', $category)
								->get();

foreach ($lists as $list) {
	// This triggers a query for each item!
	$master = $list->master;
	$category = $master->cardCategory;
}
After (Eager Loading):
// Relationships fetched in a single query upfront
$lists = CardList::with('master.cardCategory')
					->has('master')
					->where('list_no', $listNo)
					->where('category', $category)
					->whereHas('cardCategory', function ($query) {
						$query->where('display_flg', true);
						$query->whereHas('group', function ($query) {
						$query->where('display_flg', true);
					});
})->orderBy('sort_no')->get();
Accessing relationships inside a loop triggers lazy-loaded queries per item. Eager loading fetches them in bulk, eliminating repeated database round-trips. This single change reduced database round-trips from 100+ queries (one per row of data) down to ~3–5 queries per search request.
2. Unnecessary Iteration Over Empty Positions
The matching logic was iterating through a fixed range of 1–100 positions even when most of them had no data. In categories with sparse data (say, 20 actual entries out of 100 slots), this meant ~80% of the loop was doing nothing but checking isset() against empty positions.
Before:
// Iterating over all 100 positions even when only a few had data
for ($sortNo = 1; $sortNo <= 100; $sortNo++) {
	if (isset($recodes[$sortNo])) {
		// process...
	}
}
After:
// Use actual sort numbers to reduce unnecessary iterations
$sortNumbers = array_keys($records ?? []) + array_keys($group ?? []);
$sortNumbers = array_unique($sortNumbers);

foreach ($sortNumbers as $sortNo) {
	$groupFlg = isset($group[$sortNo]);
	if (isset($recodes[$sortNo])) {
		// process only existing data...
	}
}
On its own this wasn't the largest bottleneck, but combined with the other changes it contributed to the overall reduction—especially in the data processing phases where timing logs showed time being spent on iteration-heavy logic.
3. Pre-fetching Related Data in Batches
Instead of fetching data repeatedly inside loops, I pre-fetched all needed data upfront:
// Pre-fetch CardLea data once for the entire category
$cardLeas = \App\CardLea::getListByCategoryId($card_category_id);
$cardLeaData = [
	'names' => $cardLeas->pluck('name', 'sort_no'),
	'levels' => $cardLeas->map(function ($item) {
		return [
			'sort_no' => $item->sort_no,
			'name' => $item->name,
			'color_code' => $item->color_code,
		];
	})->keyBy('sort_no'),
	'targets' => $cardLeas->pluck('lea_flg', 'sort_no')
];
Since the dataset per category was relatively small, batching this data upfront was a practical tradeoff that reduced query overhead without introducing significant memory cost.
Improvements Implemented
Query Optimization
Some of the changes included:
- Removing redundant query conditions
- Selecting only required columns instead of full objects
- Preloading relationships to avoid repeated queries
// Select only necessary columns to reduce memory usage
$query = CardList::select(
	'sort_no',
	'list_no',
	'master_id',
	'name',
	'suffix'
)	->where('category', $category)
	->whereHas('cardCategory', function ($query) {
		$query->where('display_flg', true);
		$query->whereHas('group', function ($query) {
		$query->where('display_flg', true);
	});
})	->whereIn('master_id', $searchIds)
		->orderBy('list_no')
		->orderBy('sort_no');
Redis Caching (With Safe Invalidation)
After the query improvements, caching provided another large win. Because search results are often repeated, I implemented Redis caching with different TTLs depending on complexity—single-card searches get a 24-hour cache since those results are more stable and most commonly repeated, while multi-card combination searches use a shorter 3-hour TTL because the result space is larger and less likely to be cached effectively for long.
// Dynamic cache TTL based on search complexity
// Single card: 24 hours, Multi-card: 3 hours
$cacheTime = (count($searchIds) === 1) ? 60 * 60 * 24 : 60 * 60 * 3;
$cacheKey = implode('-', request('card_id'));
return Cache::tags(["Search"])->remember(
	"row_count_{$category}_{$cacheKey}_{$mode}",
	$cacheTime,
	function () use ($category, $searchIds, $mode) {
		return $this->getRowCount($category, $searchIds, $mode);
	}
);
Observer Pattern for Cache Invalidation
To avoid stale data, I used tagged cache invalidation via Observer events when card data changes:
// CardList.php - Automatic cache invalidation on model changes
class CardList extends Model
{
	public static function boot()
	{
		parent::boot();
	  static::saved(function ($cardList) {
		if ($cardList->wasChanged()) {
			Cache::tags(["ViewList"])->forget("ViewList_{$cardList->list_no}_{$cardList->category}");
			Cache::tags(["Search"])->flush();
		}
		});
	}
}
Results
After these changes, the latency improved significantly:
| Environment | Before | After | Improvement |
|---|---|---|---|
| Staging | 12.24s | 1.89s | 84% faster |
| Production | 17.77s | 988ms | 94% faster |
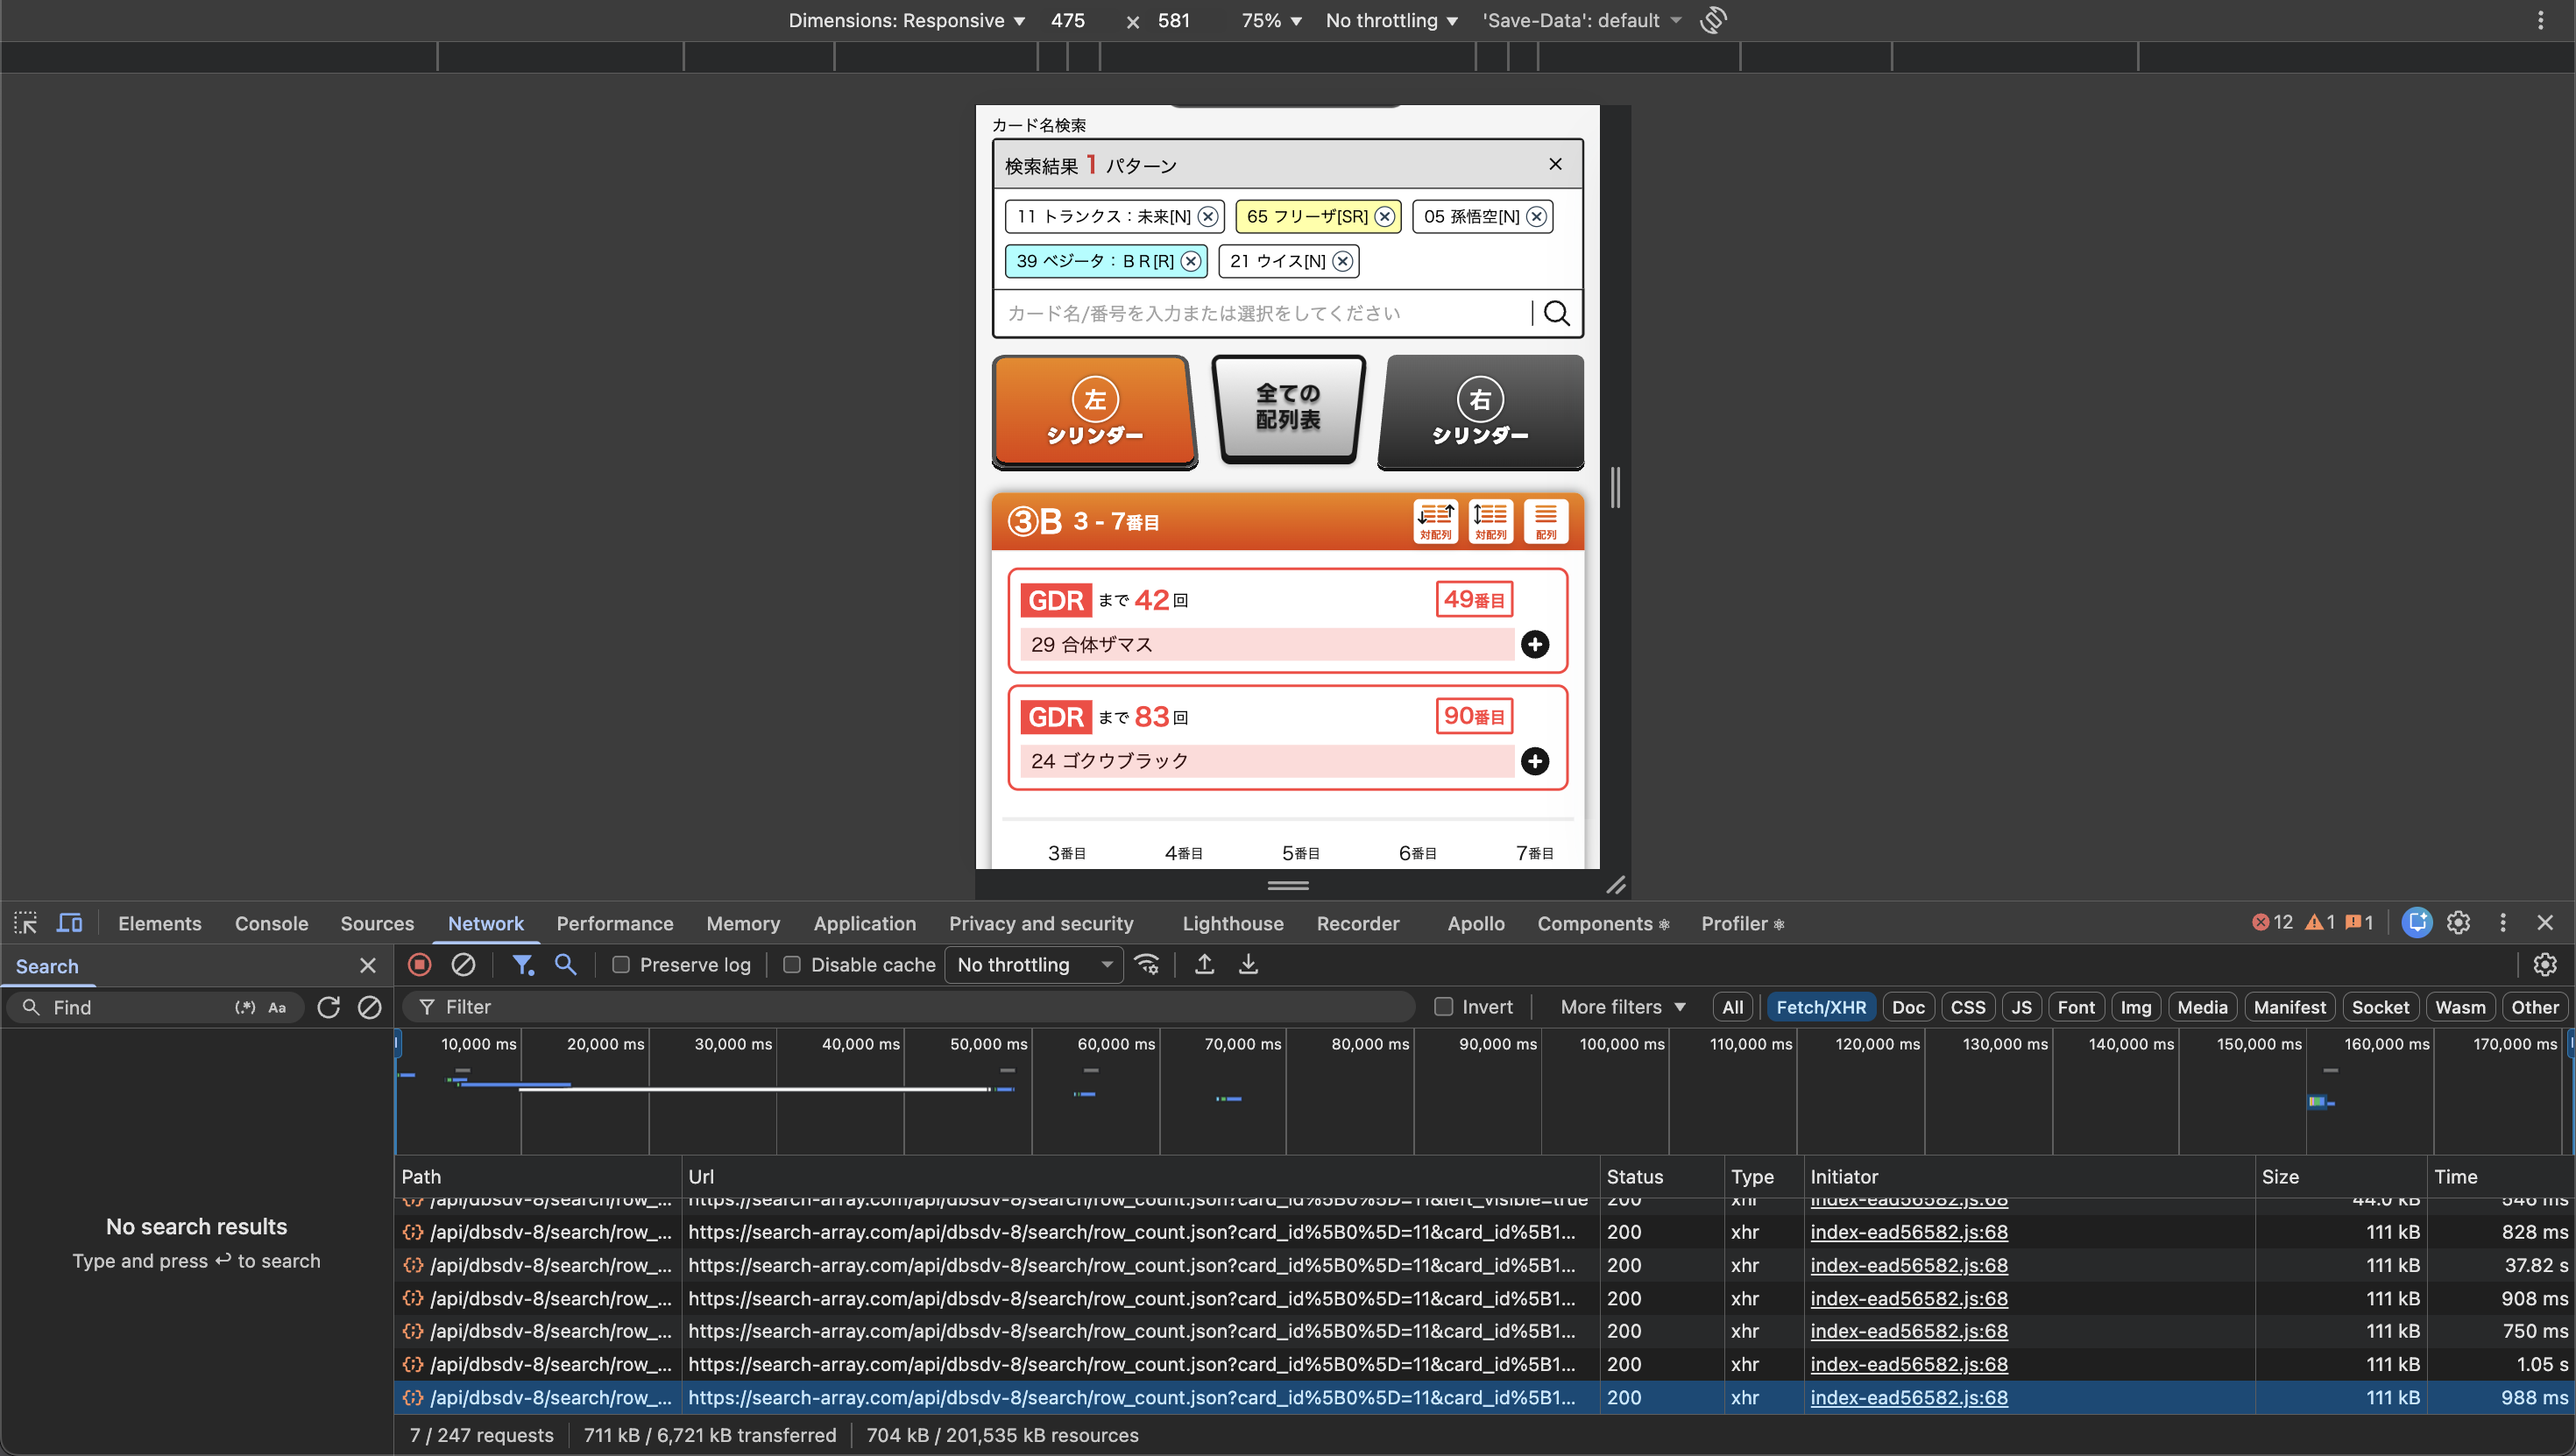
Here's the actual network panel comparison showing the improvement:
Before optimization (17.77s):
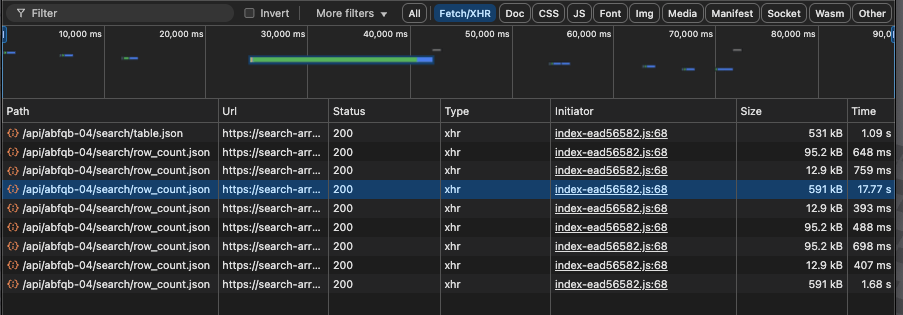
After optimization (988ms):
This brought the endpoint into a much more usable range.
What I Learned
This was one of my first experiences working on performance issues in a real production system, and a few lessons stood out:
- Measurement before optimization — adding timing logs across processing phases told me exactly where the seconds were going. Without that, I would have been guessing.
- N+1 queries can silently destroy performance — the endpoint looked fine in code review, but 100+ lazy-loaded queries per request were invisible until I profiled it. Eager loading with
with()turned out to be the single highest-impact fix. - Small query-shaping changes compound — selecting only needed columns, filtering early, and reducing iteration scope each contributed incremental gains that added up.
- Caching is powerful, but only as good as its invalidation — without the Observer pattern flushing stale data on model changes, the cache would have introduced consistency bugs instead of solving performance problems.
This work gave me more confidence working with backend performance. I'm continuing to explore production performance patterns, and I'll be writing more about what I learn.